As a lot of you will know, Google has a host of tools available for web developers and bloggers on everything from Analytics, to sharing documents, Adsense and even Adwords where you can advertise your site at the top of Google search pages.
Today, we’re starting with Analytics which allows you to track everything from the age and gender of your visitors to how a specific post has performed on your website.
So let’s get started!
Setting Up An Account
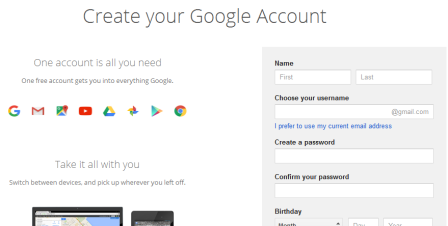
- Head on over to https://accounts.google.com and create a simple google account using your
email address and a password. If you already have a google account for Gmail or Youtube, you will be able to sign in with this. - Once registration is complete, head on over to google.com/analytics and click on “sign in” on the top right corner, before selecting “Google Analytics” from the drop down menu.
- You will then be redirected to a new page where you will be asked to “sign up”, click on this.
- Enter an account name of your choice, your website and a few other straight forward questions. I would recommend leaving all of the “Data Sharing Settings” ticked as recommended by Google themselves. However, do have a read through them and decide for yourself before clicking on “Get Tracking ID”
- Accept the terms and conditions once you have read them.
- You will then be issued your verification code which you will need to insert into your html, PHP or Tags of every page you wish to use analytics for on your website. (I recommend the index page first and foremost but ultimately the whole website.)
- Once that is done, your site is verified and you can move onto using Analytics!
Okay so now that you have set up your account, it might take a day or so to show any information. Once this appears, you’re ready to start viewing your website or blog’s analytics.
“Analytics” basically refers to visitor information such as:
- How many people visited your website or individual page
- What time they visited
- How they found you (if they clicked a link on social media or search engine)
- How long they spent viewing the content (and if they clicked on links etc)
- The age and gender of the visitor0
- Location of the visitor (US, UK, Australia, Europe, China etc)
A lot of terminology on Google can be confusing if you’ve never used Analytics before, so I thought before we went any further that I would explain some important ones.
- Sessions – This refers to a group of interactions from one user. A session refers to multiple pages being viewed, social interactions and events.
- Users – An individual who Is viewing your content
- Page Views – How many pages your visitors looked at on the site.
- Pages/Session – How many pages were viewed during a session
- Avg. Session Duration – The amount of time spent on the site
- Bounce Rate – The Percentage of visitors who leave your site after viewing just one page.
- % New Sessions – percentage of views from new visitors to your website (rather than recurring)
So there you have all of the Google Terminology explained. Now, let’s move on to navigating through your Analytics control panel.
Once you’ve signed in to your analytics account, you will be taken to a page that looks like this:
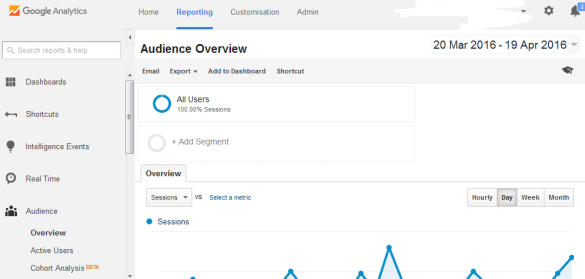
So let’s just talk through some of the navigaton on the left side where you will see options such as Dashboard, Shortcuts etc
- Dashboards
Dashboards basically allow you to create your own “dashboard” where you can view the elements which are most important to you at a glance. For more information on setting up a Dashboard, head on over to Google Help Pages.
- Shortcuts
Shortcuts allows you to view your most commonly viewed reports straight from your home tab. For more help on Shortcuts, visit Google Help Pages.
- Intelligence Events
Intelligence Events lets you know about changes in traffic on a daily, weekly or monthly basis. For fore help on Intelligence events, Click here.
- Real Time
This is addictive!! Say for example you Tweet a link to your followers and want to see how it translates to clicks on your site, then click on Real Time where you will see activity as it happens. It really is addictive to watch. I’ve spent many hours watching people roam my website. #GetALifeHolly
- Audience
Now this is the most important aspect of Analytics (In my opinion). This is where you find out who your visitor is, where they came from, how they got there, where they clicked, how long they stayed, their gender, age and location and so forth.
By clicking on ‘overview’ you will be given a brief look at your demographics such as how many visitors you received during a specific time frame. You’ll be given a few different statistics such as Bounce Rate and Pageviews which I referred to earlier. You’ll also be given a list of nationalities of your visitors whether they be viewing from the US, UK, Australia, Europe or otherwise.
- Active Users
If you look at the navigation on the left again, you will see “Active Users”. To put it simply, Active Users are unique visitors. For me, I use this the least of all the features on the Analytics.
- Demographics
The Demographics overview will let you know how many of your visitors are male or Female. It will also let you know which age group they fall into which is great for tailoring future content.
- Interests
The ‘Interests’ section lets you see what interests your visitors have. So for example they might be sports fans, or car lovers. Google is a clever search engine and collects a lot of information from it’s users.
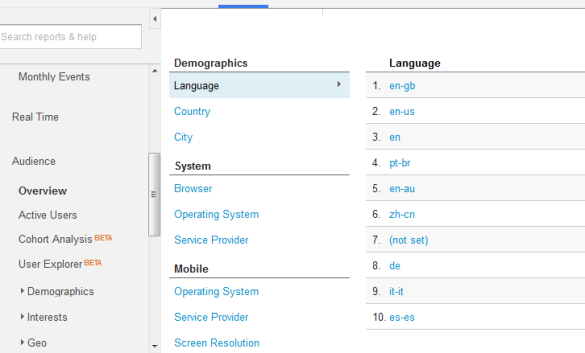
- Geo
This will show you which Geographical location you are being visited from. This is really handy again for catering content to your main visitors – for example if 7% of your website’s visitors are visiting from Australia, it might be worth referring to Australian issues or events on your website.
- Behaviour
This basically lets you know what your visitors did whilst viewing your content. You will see how long they spent on the site, which pages they visited, which links they clicked and if they engaged or interacted with you – such as sharing your links etc.
- Technology
Technology allows you to see which web browsers and internet networks were used to find and browse your website. So for example, this will let you know if the majority of your visitors used Firefox or Internet Explorer.
- Mobile
Mobile will inform you of which device they used when visiting your website, for example, Tablet, Mobile or Desktop. Google has even listed exact phone and tablet models of your users, so you will be able to see if the majority of your visitors prefer Apple or Samsung products as an example.
- Custom
This is pretty self explanatory but again, Google give you the option to customise which items you view so you can find it all in one place.
- Benchmarking
This is a VERY important part of Analytics. Benchmarking let’s you see how your visitors came across your website. So for example, if they clicked on a link in Twitter, found it in a search engine, email newsletter or directly typed it into the URL field. This is important so that you can focus on the traffic sources that give you the highest amount of views.
- Users Flow
Users Flow let’s you see which page your visitors landed on when they first entered your website and which demographics landed there.
- Acquisition
This is very similar to benchmarking but is much more streamlined. It allows you to see the referring sites and/search that was used to find your website at a glance.
I think I’ve mentioned everything there is to know about Google Analytics. Feel free to let us know if there’s anything I’ve missed and I hope this has been useful to you – I know that when I was starting out, a guide like this would have made my life much easier!
As always, let us know your comments below or tweet us @purelysocialtip
Until next time!
Holly x
